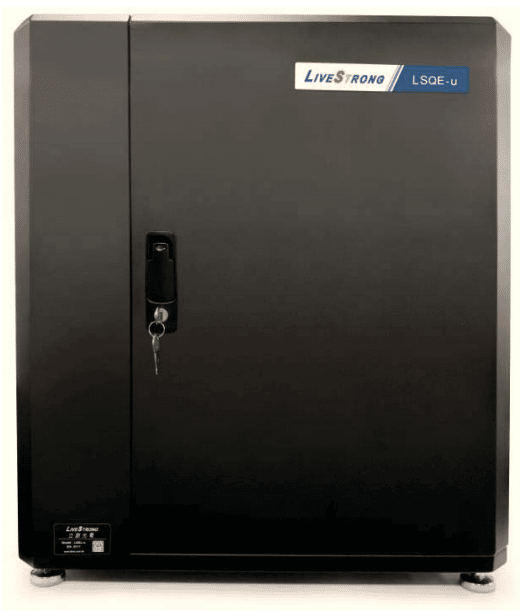
High Signal-to-Noise Ratio and High Resolution Accuracy - Preferred for Chalcogenide Stacked Cells*
Quantum efficiency test system
Quantum Efficiency Measurement System
The system uses highly efficient light receiving and stable measurement modules to provide high intensity monochromatic light with excellent signal-to-noise ratio and high resolution hardware to capture signals for fast and accurate measurement results.
will bring the following advantages to your research.
- AC Mode EQE Measurement
- Small light spot (50~1000 um)
- Large dynamic range (>8th power of 10)
- Auto/repeat scan with voltage bias
-
Automated EQE/SR Analysis
The spectral response data can be used to analyze the energy gap, optical loss, electrical loss, junction quality, diffusion length, carrier collection efficiency, temperature coefficient, and current matching conditions of multi-junction solar cells, which will help to understand the characteristics of photovoltaic devices and solar cells, and provide a basis for further improvement of the preparation process. The system is based on the following The system uses a high efficiency light collection and stabilization measurement module, which can provide high intensity monochromatic light with the best signal-to-noise ratio and high resolution signal acquisition to achieve fast and accurate measurement.
- Configure reference detectors to calibrate and measure spectral response/quantum efficiency
- Equipped with Czerny-Turner multi-grating monolithic light meter, <10-5 low stray light, with high repeatability and stability, providing high-purity monochromatic light
- Built-in AM1.5G spectrum, customers can also input their own, and calculate the full spectrum of short-circuit current density
- A high-resolution measurement instrument with low signal noise captures active signals and provides accurate and stable signals without the need to operate a lock-in amplifier for complicated settings.
- Measurement results of
- Can measure the energy gap of solar cell materials and provide customers with important material parameters
- Includes direct flow measurement mode, modular integration into the system, no need to disassemble any hard equipment
- Configurable voltage for modulating structures with street level, which can simulate the optical response under different bending energy band conditions. The carrier collection efficiency can be measured by
- Forward/reverse bias conditions to evaluate
- Configurable polarization function for evaluating certain types of solar cells with photo-excitation non-linearity (optional)
- Evaluable carrier collection rate (optional)
- Can be used with variable temperature test platform to study the temperature coefficient and provide the energy gap energy and short circuit current Jsc related parameters (optional)
- Light aging or light-induced decay (LID) evaluation study (optional)
- The reflectivity measurement module can be used to provide internal quantum efficiency measurement (optional), and customers can also input reflectivity data to calculate internal quantum efficiency.
- Current-voltage (I-V) characteristic curve measurement and analysis of related parameters (optional)
- Customized hardware expansion according to customer's other application requirements (optional)
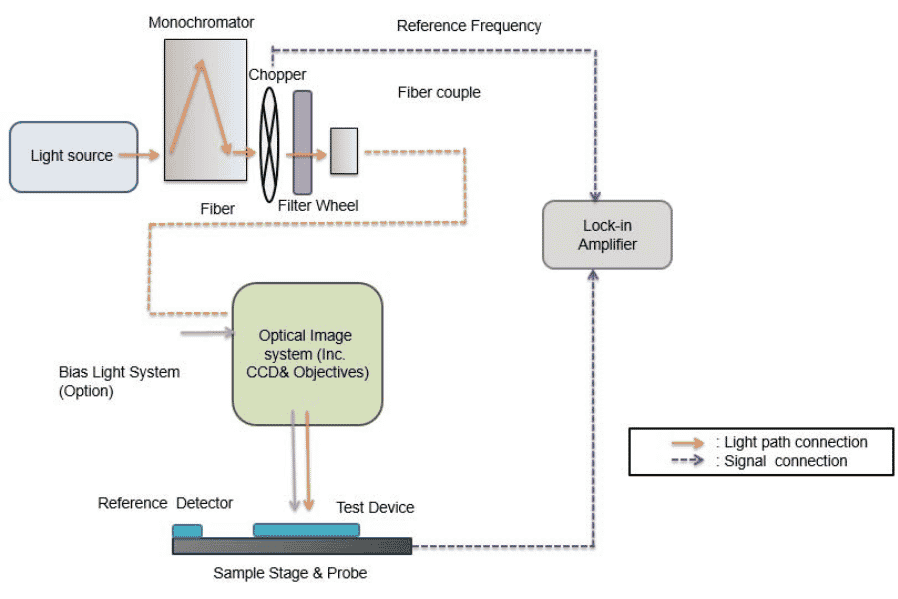
System Architecture Diagram
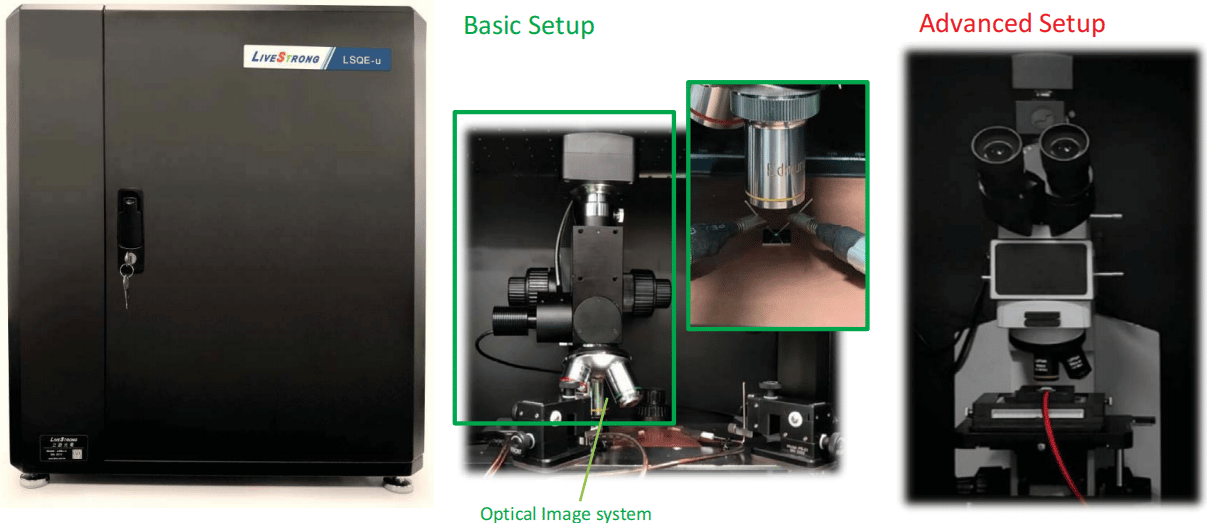
System physical diagram
| Projects | Specification |
| Light source system | (1) Wavelength range : 300 to 1100nm ( other options : 200nm~400nm, 1100nm~1400nm &400~2000nm or longer to 3000nm) |
| (2) Xenon lamp or other light sources; with high-efficiency light collection module | |
| (3) Optical Stability (Optical Stability):2.0% | |
| (4) With the light source position three-axis fine-tuning function | |
| Single optical output system | (1) Focal Length (Focal Length): ≧ 110mm |
| (2) Grating wavelength coverage range: 300~1100nm (or other wavelength bands) | |
| (3) Relative aperture (ApertureRatios): f/3.9 | |
| (4) Wavelength resolution: 1, 2, 5and10nm (system default) or other customization | |
| (5) Scan interval: 0.1 -500nm, adjustable | |
| (6) Correctness of wavelength: ±0.6nm | |
| Optical imaging systems | (1) With microscope module, the light spot can reach ~100um diameter; adjustable or other customization |
| (2) Camera resolution: ≧ 18 million pixels; single pixel≦1.25μm | |
| (3) Total magnification: 4-50X; Option: 100X | |
| (4) Image resolution: more than 3 microns, also can be used with different objective lens to observe large samples | |
| Automatic filter system | (1) Up to 5 filters can be placed |
| (2) Automatic control or manual control | |
| Uniform light chopper | (1) Frequency range 4~200Hz / 20~2000KHz / 200~10KHz |
| (2) Frequency resolution up to 0.01Hz, stability < ± 0.05Hz | |
| Sample measurement platform | (1) A set of manual sample probe platform |
| (2) At least 4 probe holders can be placed on the platform | |
| (3) Placeable sample size: 5mm2~ >300cm2 | |
| (4) Tri-axis fine adjustment probe holders: two sets, tri-axis resolution 2μm, tri-axis maximum stroke 12mm | |
| (5) Probe holder: Magnetic and insulated base | |
| (6) One box of tungsten steel probe: the probe size can be matched with the probe holder function and 200μm tungsten tip | |
| (7) Other sample stations or custom platforms | |
| Calibration detector | Si (200~1100nm) |
| Other options: InGaAs (1000~2000nm), Ge (900~1800nm) or other custom-made, also with third party | |
| Traceable certification | |
| Measurement data acquisition system | (1) AC mode, DCmode or AC & DC plus bias, polarization acquisition mode |
| (2) Minimum current resolution: 10fA | |
| (3) Dynamic range: :>100 dB | |
| (4) Maximum gain: 108 | |
| (5) Output bias voltage range: 0~±10V | |
| (6) Time constant: 10ms~20Ks | |
| (7) with automatic gain does not automatically adjust the phase of the function | |
| (8) Interface: RS232 and GPIB (IEEE488) | |
| (9) Phase measurement resolution: 0.01o | |
| (10) Stability: <6ppm/°C | |
| (11) Offset degree: X.Y.R can be offset to full travel +/-105% | |
| (12) Sampling rate:>500/s with 8000 points memory buffer | |
| Measurement Software | (1) Absolute light intensity correction |
| (2) Spectral Response / External Quantum Efficiency Measurements | |
| (3) Automatic, real-time short-circuit current density (Jsc) calculation | |
| (4) Automatic calculation of single-wavelength short-circuit current | |
| (5) External reflectance import to calculate internal quantum efficiency (IQE) | |
| (6) Solar cell material energy gap calculation | |
| (7) Optional: Real-time observation of sample measurement images; and with image storage function | |
| (8) With database function | |
| (9) Data saving format: txt & jpg | |
| (10) Optional: Illumination I-V curve measurement and calculation of solar cell parameters, including | |
| Voc, Isc, Jsc, Vmax, Imax, Pmax, Fill Factor (FF), Efficiency, Rs, Rsh. no | |
| The I-V curve of illumination provides the saturation current (JO) and the ideal factor (n) about the quality of the energy gap interface | |
| Shielded concealed box | (1) Open type movable door |
| (2) With electromagnetic shielding function | |
| Optical bias source (optional) | (1) Single or dual band halogen or 収光二极管 (LED) lamps; adjustable intensity |
| (2) Fiber optic light path output, can also be used with other light path | |
| Other options | (1) Internal quantum efficiency measurement module |
| (2) Measurement of I-V curve under specific monochromatic illumination light | |
| (3) I-V hysteresis curves can be measured in the forward and reverse bias scanning range | |
(4) XY automatic scanning platform |
Test Software
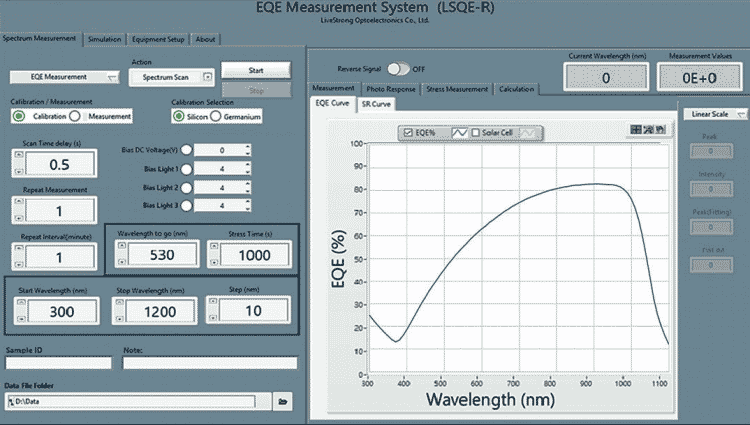
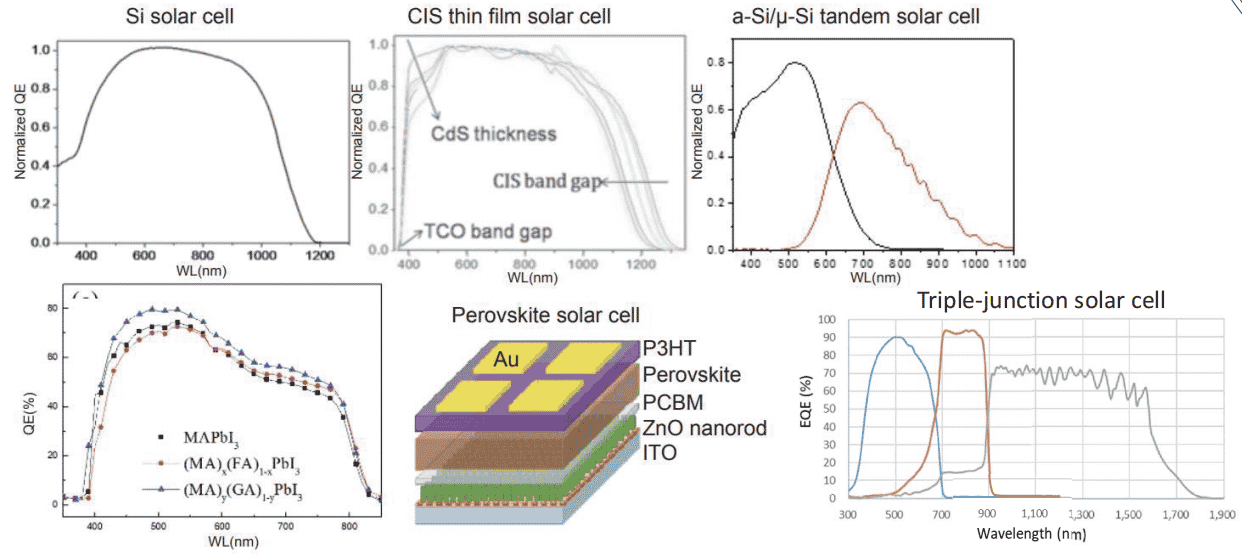
EQE Spectrum - Types of solar cells
Probe and View @ EQE Measurement
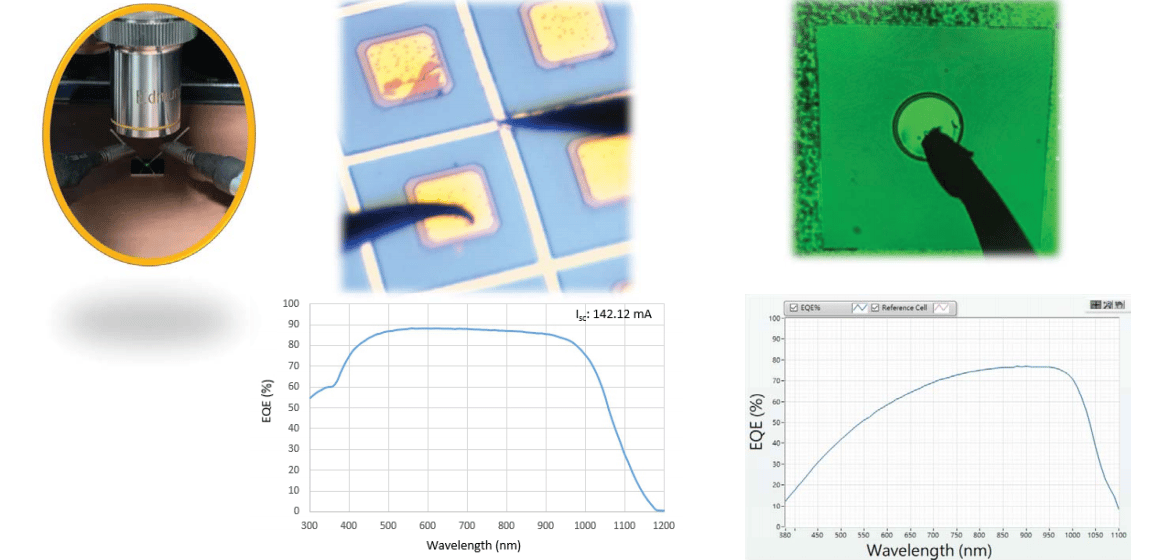
Related Applications
