
The only means of in-situ real-time observation of battery electrochemistry at Lasertec Corporation, Japan*
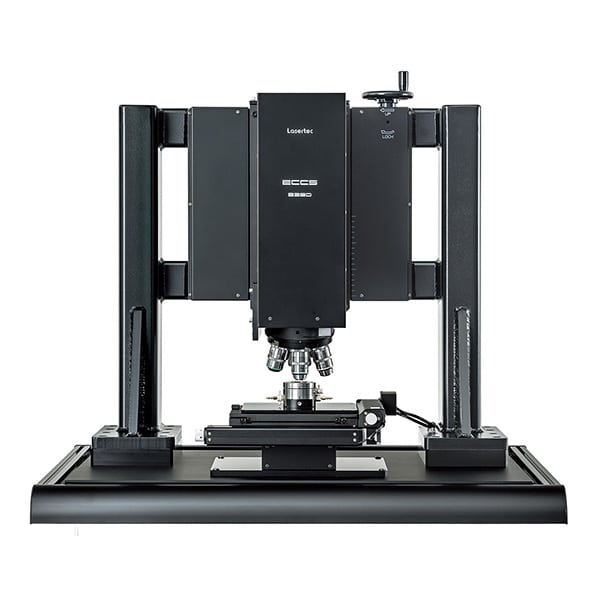
ECCS B310/B320 Electrochemical reaction visualization confocal system
Electro-Chemical Reaction Visualizing Confocal System
Real-time in-situ observation and further quantitative analysis are available, making it the best tool for cell material and process improvement.
will bring the following advantages to your research.
Presenting the charging and discharging process with high-definition color animation
Equipped with powerful quantitative analysis software
Quantitative analysis of the mechanisms of lithium inlay, swelling, shrinkage, and dendrite generation
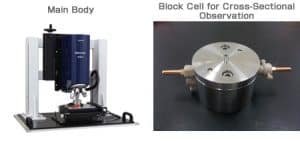
Can correspond to button battery and soft pack battery samples
Dramatically improve R&D efficiency and effectiveness
[System Introduction]
The ECCS B310/B320 confocal system provided by Lasertec Japan can observe and quantify the distribution of electrochemical reaction processes in lithium batteries under charge and discharge conditions. This system uses confocal microscope technology to observe the inside of lithium battery in charge/discharge state.Expansion, contraction, uneven reaction distribution of active substances, dendrite, gas generationThe ability to easily visualize and quantify initial battery evaluations that would have taken weeks or months can be reduced by days
[Technical Advantages]
- A true color confocal optical system is used to receive only the reflected light from the focusing surface (the surface of the electrode active substance).
- Therefore, high-definition color observation with high color separation is possible, independent of the glass surface and electrolyte, etc.

[Application Areas]
| Detectables | Test items |
|---|---|
| Overall battery | Checking the resistance ratio of ion movement and and electron movement |
| Clarify the conditions for dendrite production and the movement after production | |
| Visualization of magnification characteristics | |
| Visualization of cyclic aging | |
| Visualization of temperature characteristics | |
| Analysis of sodium battery and sulfide all-solid battery | |
| Analysis of next-generation materials such as PSG graphite film | |
| Can correspond to full battery or half battery | |
| Negative Pole | Embedded visualization |
| Real-time observation of expansion and contraction | |
| Stage analysis of graphite negative electrode according to color | |
| positive pole | Li ion emission visualization |
| Real-time observation of expansion and contraction | |
| Electrolyte | Visualization of gas generation and further confirmation of generation location |
| Check the effect of additives | |
| Conductive agent | Electric centralized visualization |
| Dispersion status visualization by embedding | |
| Verification of the effect of carbon nanotubes | |
| Binder | Binding properties between test active substances |
| Verification of the binding between the collector foil and the active substance | |
| Diaphragm | Check the effect of different materials embedded |
| Confirmation of the effect of ceramic coating on reaction distribution | |
| Visualization of the effect of metallic foreign bodies in the electrode |
[System Specifications]
- Observation Room

- Temperature control system (-30℃-80℃)

- Other
[Test Data]
Reaction distribution analysis
Negative Pole
The graphite-based negative electrode undergoes several stages during the charging process, eventually reaching 100% SOC, with lithium ions inserted between all layers.
At this time, the color of the active substance changes from gray before charging to blue → red → gold, and the reaction distribution in the direction of film thickness can be quantitatively analyzed from this color.


positive pole
The general positive electrode does not show the color change that occurs in graphite-based negative electrodes, but by capturing the small change in brightness caused by charging and discharging, it is possible to quantify the negative electrode with the same film thickness direction of response distribution.


Simultaneous analysis of positive and negative reaction distribution
2017 Battery Discussion Meeting Presentation (2A14)
The response distribution of the positive electrode can be analyzed from the brightness and the response distribution of the negative electrode from the hue at the same time.

Expansion/shrinkage analysis
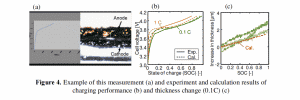
ECCS expansion/shrinkage analysis allows for small changes and real-time analysis that cannot be measured with micrometers or displacement gauges. Each composite layer can also be selectively measured by creating a "line image" in which any of the lines of the acquired image are arranged side by side in chronological order.


Dendrite observation
Electrode void fraction measurement
The void fraction can be evaluated by measuring the roughness of the electrode surface using the function of the ECCS B320 as a microscope.

Electrode void fraction measurement
The void fraction can be evaluated by measuring the roughness of the electrode surface using the function of the ECCS B320 as a microscope.

Related Applications

