Ultrafast fluorescence upconversion spectroscopy system
Chemical biology macromolecular structure, function and reaction kinetics studies* Ultrafast
Shengye Jin, Dalian Institute of Chemical Physics, Chinese Academy of Sciences
Fluorescence lifetime detection is one of the common techniques used to determine the excited state lifetime and carrier kinetic processes of a material. The correct selection and use of fluorescence lifetime detection techniques and the correct acquisition and analysis of fluorescence lifetime kinetics are particularly important for determining the excited state properties of matter, material properties and carrier kinetic processes. In the past, we often found some misunderstandings and misconceptions in the technical parameters and kinetic analysis of fluorescence lifetime detection equipment, which led to the wrong judgment of the carrier kinetic properties of the studied material. Therefore, we would like to introduce in this short article the physical meaning and kinetic understanding of some important technical parameters of fluorescence devices.
01The basic principle of fluorescence lifetime
Fluorescence is the absorption of excited photons in luminescent materials after the occurrence of electron jumps in the energy level orbitals, resulting in excited state species (such as excitons, free charges, etc.) through the process of radiation compounding issued photons. Fluorescence reflects the process of changing the material from ground state to excited state and subsequently decaying back to ground state, and its fluorescence lifetime reflects the lifetime of the excited state of the material. We illustrate this process using the example of molecule C:

The ground state C molecule absorbs the excited photon and changes to the excited state C*, and the excited state Ccan decay back to the ground state by either radioluminescence (kr) or nonradioluminescence (knr) pathways. According to the primary reaction rate equation, at moment t after excitation, CThe decay rate of

Integration over time yields the concentration of C* at moment t as

where C0* is the total concentration of excited states at the moment t=0 (i.e., the total concentration of excited states produced by excitation), k0= kr + knr.
In fluorescence lifetime detection experiments, the detector detects the luminescence intensity per unit time i.e. the luminescence rate of the sample, d(photon)/dt, thus:

In a realistic detection process (e.g. using time-correlated single photon counting (TCSPC) techniques), due to the limitations of the time accuracy of the device, the detector actually determines the luminescence rate by collecting the number of photons (ΔP) over a small period of time (bin time, Δt), when Δt is sufficiently small:

where A0 = krC*0. The experimentally collected fluorescence lifetime curve can be shown in Figure 1.
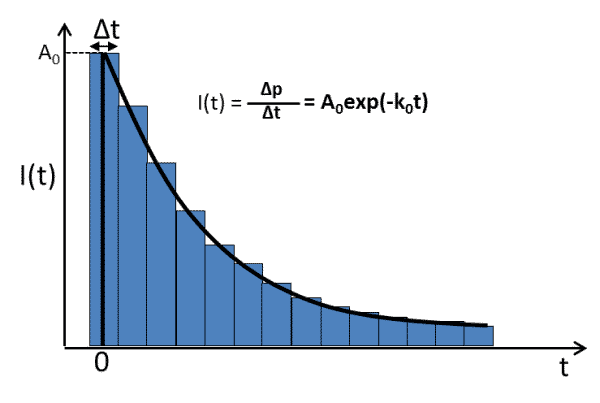
Figure 1. Typical fluorescence lifetime curve diagram
The entire fluorescence lifetime curve is composed of ΔP values at successive Δt (bin time) intervals, mainly consisting of rising edge (excited state formation) and falling edge (excited state decay) components. The formation of the excited state is generated by optical excitation, and the rising edge is determined by the formation mechanism of the excited state (e.g., direct excitation or energy transfer) and the instrument response function (IRF, instrument response function). Among them, the IRF of the instrument determines the time resolution of the fluorescence lifetime detection, which we will explain in detail later. The fluorescence lifetime decay part can be expressed by Equation (4). By exponentially fitting the decay curve, the fluorescence decay rate constant k0 or fluorescence lifetime τ0=1/k0 of the sample can be obtained.** It follows that the fluorescence lifetime τ0 obtained in the fluorescence lifetime detection is the sum of the rate constants of all decay channels (both radiative and non-radiative) in the excited state, rather than the rate constant of the radiation complex only detection.Also the A0 in the decay curve fitting is the Δp value (number of photons) measured in the laboratory at the moment t = 0. According to equation (4) it can be derived that A0 should be A0 = krC0 (The photon detection efficiency of the detector is not considered here). For the selected test sample, kr (radiation complex rate) can be considered as a constant under stable conditions, so that A0 in the decay curve can be considered to be proportional to C0, the total concentration of excited states in the sample with the characteristic k0 decay constant.
In the above schematic description, we are using the single-exponential decay equation as an example. However, in the actual testing process, most of the samples show a double or even triple exponential decay process. I believe that the existence of multi-exponential decay process is due to the non-homogeneous spatial and temporal scales of the samples. Spatial non-homogeneity refers to the fact that the numerous luminescent individuals (e.g., individual molecules or individual nanoparticles) contained in a macroscopic sample differ from each other (the individuals themselves or their microscopic environment). For a single luminescent individual in the sample, the microenvironment in which it is located may be very different, for example, the distribution of defect states is not uniform, the temperature is not uniform, the surface interface distribution is not uniform, etc., which causes the k0 of the luminescent individuals in the sample is not exactly the same, but there is a distribution, so that the fluorescence lifetime curve of the macroscopic sample reflects the multi-exponential decay process after the average of many individuals. In addition, during the fluorescence lifetime acquisition process of the sample, the fluctuation of environmental conditions or the occurrence of certain physical processes can also cause the sample to show different fluorescence lifetimes at different acquisition moments, resulting in the final fluorescence lifetime curve to show a multi-exponential process. We can derive the fluorescence lifetime values of different fluorescence lifetime components (k1, k2 ...) and the contribution of each component in the overall lifetime curve (A1, A2 ...) by fitting the multi-exponential equation of Eq. (5) as follows:

In addition, the above description is in terms of a primary reaction (e index), treating the excited state species as a whole (e.g., a single linear state or an exciton). If the luminescence is produced by a complex of free electrons and holes, the fluorescence lifetime decay curve needs to be expressed in terms of the second-order reaction (power exponent), i.e:

The kinetic process is more complex, so please refer to the corresponding literature for related studies, which will not be described here.
02Technical principle of fluorescence lifetime detection
Time-Correlated Single Photon Counting (TCSPC) is the most widely used fluorescence lifetime test method today. First of all, it should be clear that the fluorescence lifetime curve is the result of a large number of photon counts. Suppose a macroscopic (bulk) sample produces 1000 excited states in one excitation, if the detector records the luminescence intensity of these 1000 excited states at different delay times after excitation, the fluorescence lifetime curve of the sample can be obtained. TCSPC is based on the concept of single-photon statistics, and is composed of a pulsed laser, a high-sensitivity photon detector, and a TCSPC card, and its detection principle can be shown in Figure 2. The laser pulse excites the sample to produce an excited state, followed by a compound emission of fluorescence photons at moment t1 which is collected by the detector. The t1 time is then the time difference (micro-time) between the laser pulse signal and the fluorescence signal recorded by the TCSPC for that excitation. However, in TCSPC detection, not every laser pulse can produce the collected fluorescence photons (limited by factors such as sample fluorescence quantum efficiency and equipment acquisition efficiency, e.g., the number of photons per unit time (counts/s) recorded by the detector is usually 1-2 orders of magnitude lower than the laser re-frequency), so in order to record only the micro-time of the generated fluorescence photons (which can save a lot of memory), the TCSPC card records the fluorescence photons. The TCSPC card records the time difference between the fluorescence signal and the next laser pulse signal adjacent to it (t1′ in Fig. 2), and then based on the laser pulse time period T (T is fixed at the chosen laser refrequency), it is possible to obtain t1 = T - t'1. The microtimes of the collected large number of photons (t1, t2, t3 ...) are evaluated. The fluorescence lifetime curve is obtained by counting the microtimes (t1, t2, t3 ...) of a large number of collected photons.
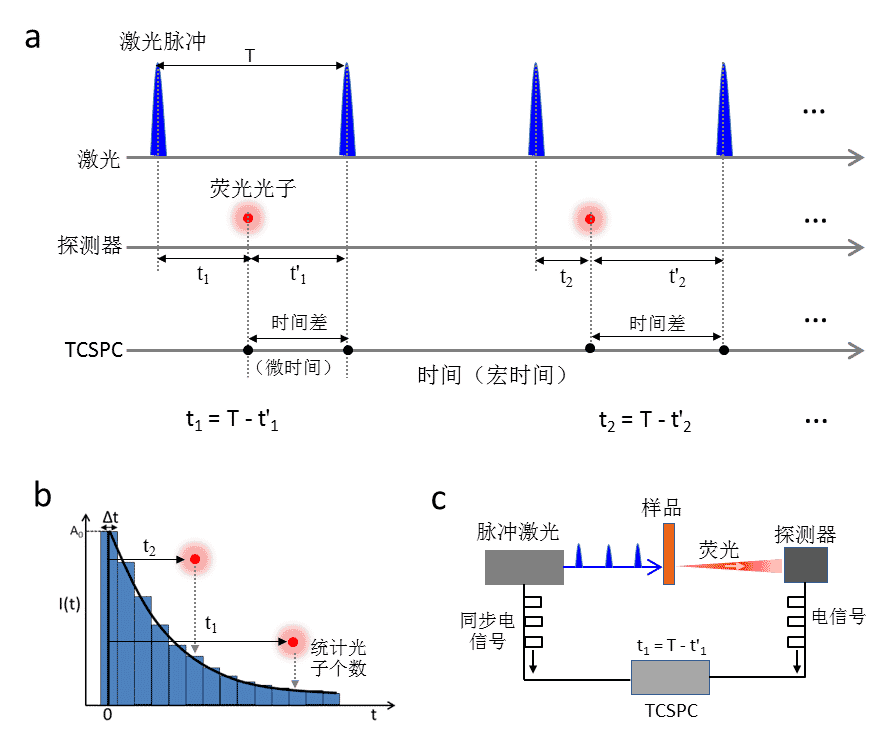
Figure 2. TCSPC fluorescence lifetime detection principle
a: TCSPC card time recording principle; b: Single photon time statistical counting to construct fluorescence lifetime curve; c: Schematic diagram of TCSPC fluorescence detection instrument structure
The micro-time statistics of fluorescence photons in TCSPC lifetime curves are based on the number of channels. If the acquisition time window is set to 100 ns and the number of channels is 4096, the time point interval in the fluorescence lifetime curve is 100 ns/4096 = 24.4 ps, which is the bin time (∆t) in Figure 1 and Figure 2, and the time axis time recording points in the fluorescence lifetime curve are 0, 24.4, 48.8, 73.2 ---. The fluorescence lifetime curve is constructed by counting the number of photons in each ∆t interval, based on the microtime of each photon. Based on the acquisition principle of TCSPC, this method can usually have a high temporal resolution and is more suitable for use in conditions with high laser re-frequencies. When the laser re-frequency is low (e.g. < 1KHz), the acquisition efficiency of fluorescence lifetime will be low (less photons per unit time).It is especially important to note that the ∆t (bin time) time is not the time resolution of the fluorescence lifetime probe, but only the timing accuracy of the TCSPC card!
In addition, there is also a concept of macro time in TCSPC detection, which is the time of recording fluorescent photons relative to the start moment of experimental acquisition and is fundamentally different from the photon micro time in fluorescence lifetime. the detection accuracy of TCSPC cards for photon micro time (time difference) can reach < 10 ps, while the recording accuracy of macro time is usually in the order of micro seconds.
The basic structure of the TCSPC fluorescence detection instrument built based on the above principle can be shown in Figure 2c, which mainly includes core components such as laser, detector and TCSPC card. The laser and detector output synchronized electrical signals when emitting laser light and detecting photons, which are detected by the TCSPC card to obtain and calculate the micro-time and macro-time of each fluorescent photon and construct fluorescence lifetime curves statistically.
In fluorescence lifetime acquisition, we also often see that the fluorescence lifetime curve does not start from the 0 moment of the time window, but there is a delay time Td (as shown in Figure 3). In fluorescence lifetime detection, the TCSPC card acquires photon microtimes by recording the synchronous output electrical signals from the laser and detector. The response time of the electronics and the transmission time of the electrical signal in the line cause an inherent time difference between the synchronous electrical signal and the actual optical signal, resulting in a delay in the fluorescence lifetime time window. The delay does not affect the fluorescence lifetime acquisition, but reduces the utilization of the time window range. The magnitude of the delay time can be adjusted by changing the length of the electrical signal transmission line or by setting the electrical signal delay parameter.
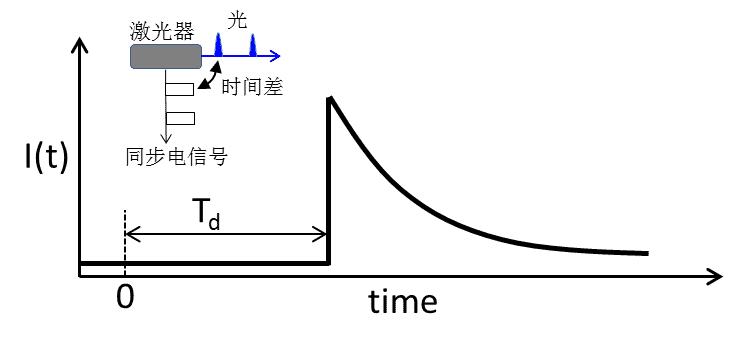
Figure 3. Delay phenomenon in fluorescence lifetime acquisition and its causes
In addition to the TCSPC technique, fluorescence lifetime can also be acquired by an oscilloscope. Unlike TCSPC in which one pulse excitation is recorded for at most one photon time, oscilloscopes can achieve high-speed continuous acquisition of fluorescence intensity after one pulse excitation to obtain fluorescence lifetime curves, and the accuracy of its time scan is determined by the bandwidth (note that it is not the sampling rate) of the oscilloscope. For example, an oscilloscope with 500M bandwidth can achieve a time scan with 2ns accuracy, which is much lower than TCSPC, while oscilloscopes with higher bandwidth (e.g., above GHz) are very expensive. Therefore, due to the bandwidth limitation, the oscilloscope method is mostly suitable for samples with longer fluorescence lifetime (e.g. phosphorescence) and detection under lower laser re-frequency conditions.
03Core parameters in fluorescence lifetime detection
To achieve accurate acquisition and analysis of fluorescence lifetime, several core parameters in fluorescence detection need to be defined first, mainly including time resolution, time window range and time accuracy.
1) Time resolution and instrument response function (IRF)
Time resolution is the most important parameter of fluorescence lifetime detection technology, which is determined by the instrument response function (IRF) of the detection system (including laser, detector and TCSPC card) as a whole. **The IRF is determined by the time response time and jitter of the optical signal into electrical signal of the electronic components used in the laser, detector and TCSPC card. In the TCSPC card, the timing accuracy can reach <10 ps, which is usually much higher than that of lasers and detectors. Therefore, the IRF of TCSPC fluorescence detection system mainly comes from the laser and detector.
In the case of lasers, the factors contributing to IRF mainly include the pulse width of the laser and the jitter of the synchronized electrical signal, as shown in Figure 4. The laser pulse width is one of the most important parameters of a pulsed laser, expressed by the FWHM (full width half maximum) value of the pulse spread in time (Figure 4). In addition, the TCSPC card acquires the laser's re-frequency and period time T by acquiring the laser's pulsed synchronous electrical signal (SYNC), which introduces a time jitter between each pulsed electrical signal, i.e., the pulse period in the electrical signal is not a precise T time, but T + jitter time. According to the micro-time (t1, t2 in Fig. 2) calculation method for fluorescent photons t1 = T - t'1, the jitter at T time (even if much smaller than T) is carried over to t1 time and thus contributes to the corresponding function of the instrument.
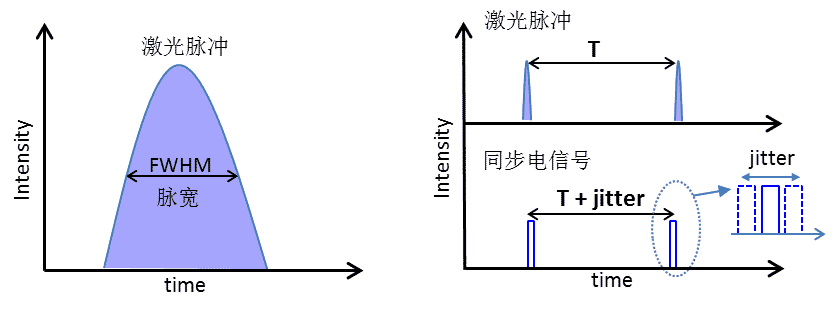
Figure 4. Laser contribution to IRF, mainly from laser pulse width and time jitter of the synchronized electrical signal (jitter)
The pulse widths of the lasers used in TCSPC probing are currently available in fs, ps and ns. The jitter of the synchronous electrical signal is usually in the order of a hundred ps. When the laser pulse width is much larger than the jitter (such as ns lasers), the IRF contribution is mainly from the pulse width, when the jitter time is much larger than the laser pulse width (such as fs lasers), the IRF contribution is mainly from the jitter. when the two are close (such as ps lasers) is their combined effect.
On the detector side, there are also problems with detector response time and electrical signal time jitter similar to those described above (as shown in Figure 5). When the detector detects a photon, it outputs a corresponding electrical pulse signal, and the rising edge of the electrical signal represents the response time of the detector (transition time); in TCSPC detection, a signal threshold (TH) is set to discriminate the valid electrical pulse signal, and then the time of arrival of the photon is accurately recorded by the constant fraction discriminator. discriminator) to accurately record the time of arrival of photons at the detector, regardless of intensity fluctuations. However, during repetitive photon detection, for those photons that arrive at the detector at the same moment, the output electrical signal has a temporal distribution and deviation from each other, i.e., transient time spread (see Figure 5), resulting in a time jitter of the detector (see Figure 5). jitter), which contributes to the IRF of the whole system.

Figure 5. Contribution of the time jitter of the detector to the IRF. The detector detects the photon and generates a pulsed electrical signal, and the time at which the photon reaches detection is determined by a set electrical signal threshold. Then, the presence of the transition time unfolding causes a time jitter (jitter) in the electrical signal of the telecommunication signal
At present, single photon detectors and detectors such as PMT are mostly used in commercial instrumentation, where most single photon detectors jitter can usually reach below 100 ps, while conventional PMT detectors jitter can reach 1-2 ns, and special microchannel plate (MCP) PMT or hybrid PMT can reach below 100 ps. Therefore, the author believes that when the system uses a conventional PMT detector, it will only be applicable to the detection of longer fluorescence lifetime samples.
It follows that the overall IRF of a fluorescence lifetime system consists of a laser and a detector, the values of which can be determined by the following theoretical equation:

The IRF of the fluorescence detection system used in the experiment can be obtained by directly detecting the scattering signal of the laser, as shown in Figure 6. the IRF value can be defined as the FWHM value of the measured IRF curve. a smaller IRF value represents a higher temporal resolution of the instrument.
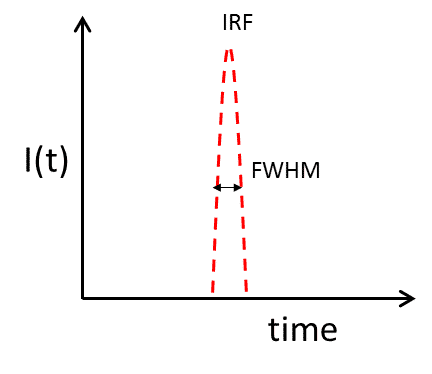
Figure 6. IRF of the fluorescence lifetime detector system
Therefore, the fluorescence lifetime profile measured in our experiment is the result of the convolution (resolution) of the IRF and the fluorescence signal together (Figure 7a). **Since IRF directly determines the time resolution of fluorescence lifetime detection, its size has a huge impact on the acquisition results and analysis of fluorescence lifetime. **Before experimental operation, a judgment needs to be made on whether the size of the device IRF is suitable for measuring the fluorescence lifetime of the sample being detected. As shown in Figure 7b, for the same sample test, the test result of a device with a small IRF will exhibit a faster and sharp rising edge process, while the test result of a device with a larger IRF will exhibit a slower and rounded rising edge process. If the fluorescence lifetime decay process contains a faster decay component, only the device with small IRF may effectively capture the fast component (IRF is smaller than the fast component lifetime), however, the device with large IRF, due to the limitation of time resolution, is likely to fail to detect the presence of the fast decay component (e.g., IRF is much larger than the fast decay component lifetime case), thus causing huge analysis of the test results bias. For example, we usually determine the concentration of defective states in a sample by detecting the fluorescence lifetime. A high concentration of defect states in the sample will lead to a fast fluorescence lifetime decay, and if the fluorescence acquisition is performed with a device with a large IRF, it is likely that the detection of the possible fast decay process will not be achieved, resulting in an incorrect determination of the sample defect state concentration. In addition, processes such as charge transfer and energy transfer in the sample as well as certain molecules and semiconductor materials can also generate or have rapid decay processes of fluorescence, and fluorescence kinetic studies of such processes and materials should also use fluorescence lifetime detection equipment with a smaller IRF.

Figure 7. a) The fluorescence lifetime curve measured in the experiment is the result of the convolution (solution) of the IRF with the fluorescence signal. b) The effect of the size of the IRF on the fluorescence lifetime curve. devices with a large IRF, limited by the temporal resolution, may not be able to detect the fast component of the fluorescence lifetime decay.
For samples with fluorescence lifetimes smaller than IRF, we can extract the fluorescence lifetime by de-convolution in data fitting. Through simulations, we found that the de-convolution method can accurately extract fluorescence lifetimes up to IRF/5 (e.g. IRF = 200 ps, de-convolution can be fitted as fast as ~40 ps). Currently, some commercial instrument manufacturers set the deconvolution extrapolation limit to IRF/10 and define it as the temporal resolution of the instrument, which I believe is exaggerated and imprecise. After all, the results of deconvolution are derived from mathematical methods of projection, rather than accurate detection, the results can only make an approximate projection of the fluorescence life less than IRF. For more accurate detection, detection equipment with higher temporal resolution, such as ultrafast fluorescence upconversion and ultrafast streak cameras, should be used.
In addition, it is important to re-emphasize that the time resolution of the fluorescence lifetime detection technique is determined by the IRF time of the system as a whole, not the bin time in the fluorescence lifetime curve (∆t in Figure 1) or the micro-timing accuracy of the TCSPC card. **Since the IRF of the laser and detector is typically much larger than the timing accuracy of the TCSPC, the IRF of the overall system is limited by the laser and detector.
Currently, commercially available fluorescence lifetime detection devices are available with a choice of different configurations of lasers and detectors, etc.In summary, for the time resolution parameter, we should focus on the following points when choosing the instrument configuration:
The IRF of the final system will be greater than or equal to the maximum time value in the above parameters.
2) Detection time window and laser re-frequency
The time window range in TCSPC fluorescence lifetime detection depends mainly on the laser re-frequency, and the maximum time window range is the cycle time of the laser re-frequency T. However, due to the electrical signal transmission delay shown in Figure 3, part of the time window range is occupied by the delay time. Generally speaking, the time window range should be chosen at least 2-3 times larger than the fluorescence lifetime, so it is necessary to choose the appropriate laser refrequency and adjust the electrical signal delay according to the fluorescence lifetime of the sample. In addition, if the TCSPC determines the bin time (∆t) of the fluorescence lifetime curve by dividing the time window range by the number of channels, a large time window will increase the bin time value (e.g., ∆t ≈ or > IRF), resulting in a lower time resolution of the system.
On the other hand, for the TCSPC single photon counting acquisition method, using a laser with too low a re-frequency means that fewer photons are collected per unit time, which will seriously reduce the efficiency of fluorescence lifetime curve acquisition as well as the signal-to-noise ratio.
04Correct display of fluorescence lifetime curve
As mentioned above, a complete fluorescence lifetime curve should include a rising edge and a falling edge. Both parts are physically significant. It is common to see certain presentations of fluorescence lifetime data in the literature that omit the rising edge component, which is inherently an incorrect approach. The rising edge represents the process of sample excited state generation, for direct excitation of luminescent species can reflect the size of the IRF at the time of detection, and can be used to determine whether the fluorescence lifetime curve has the possibility of missing fast decaying components, and can also be used to observe the process of energy transfer in some samples (or other excited state generation process), as shown in Figure 8, and therefore should be given sufficient attention. Of course, if the fluorescence lifetime is much larger than the IRF or if the fast process is not of concern, it is also feasible to ignore the rising edge at this point. In addition, the IRF needs to be considered in the fluorescence lifetime curve fitting (especially when the fluorescence lifetime is short) to obtain more accurate fluorescence lifetime fitting results.
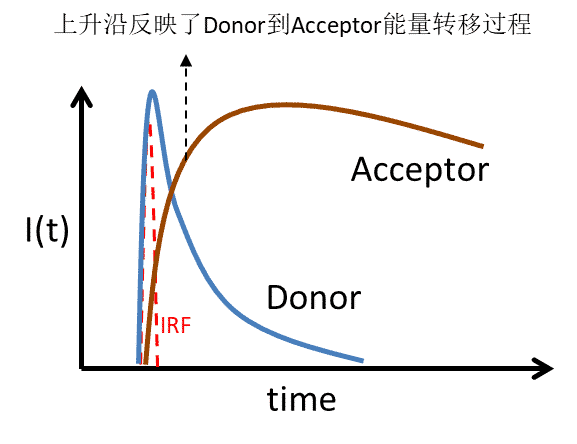
Figure 8. During the donor-acceptor resonance energy transfer, the kinetic process of energy transfer can be judged by collecting the fluorescence lifetime curves of both. If the energy transfer time > IRF, the fluorescence lifetime curve of acceptor exhibits a slower rising edge than IRF, accompanied by a rapid decay of donor fluorescence.
Source: Tristar Spectrum @ WeChat
WHEN:2022-04-19
Chemical biology macromolecular structure, function and reaction kinetics studies* Ultrafast
Chalcogenide carrier dynamics analysis* Laser scanning fluorescence lifetime (intensity)
Time-Tech Spectra Micro-area Reflection|Fluoroscopy|
Time-tech spectra ultimate cost performance ultra-fast